|
_ _ _ _ _ _ _ _ _ _ _ _ _ _ _ _ _ _ _ __ _ __ _ _ _ _ _ _ _ __ __ _ _ _ _ __ _ _ _ _ _ _ _ _ _ _ _ _ _ _ _ _ _ _ _ _ _ _ _ _ _ _ __ _ __ _ _ _ _ _ _ _ __ __ _ _ _ _ __ _ _ _ _ _ _ _ _ _ _ _ _ _ _ _ _ _ _ _ _ _ _ _ _ _ _ __ _ __ _ _ _ _ _ _ _ __ __ _ _ _ _ __ _ _ _ _ _ _ _ _ _ _ _ _ _ _ _ _ _ _ _ _ _ _ _ _ _ _ __ _ __ _ _ _ _ _ _ _ __ __ _ _ _ _ __ _ _ _ _ _ _ _ _ _ _ _ _ _ _ _ _ _ _ _ _ _ _ _ _ _ _ __ _ __ _ _ _ _ _ _ _ __ __ _ _ _ _ __ _ _ _ _ _ _ _ |
| Gender Ratio |
|
|
||
|
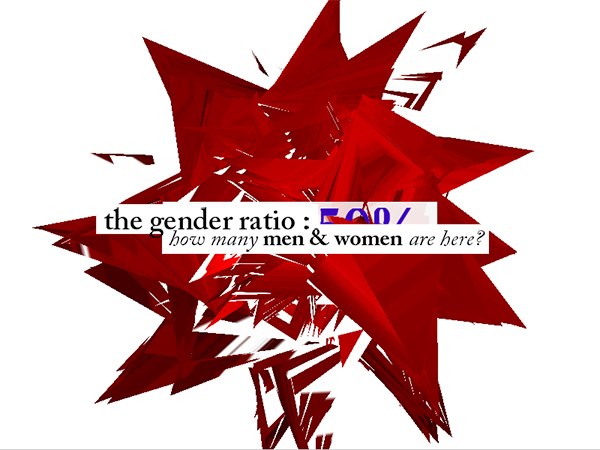
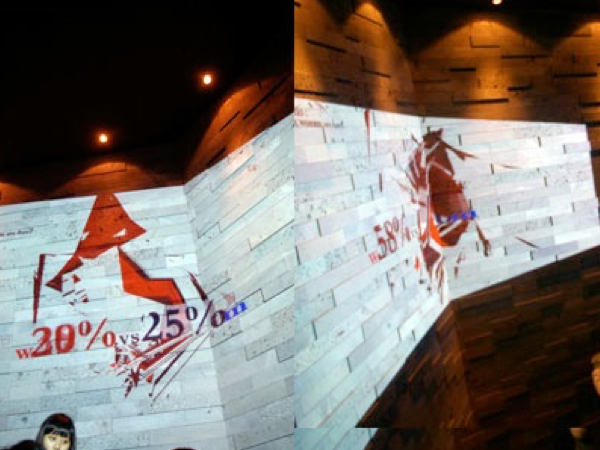
Gender ratio is a project where we experimented to see how data visualization influences our decision making process. This project was implemented at the entrance of a nightclub in Seoul, Korea. Before paying the cover charge to enter, the visuals indicate the gender ratio of the clubgoers inside. Visitors can then make a decision on whether or not they want to enter with this information. |
This project is a very simple experiment that uses only one data set. However, when trying to visualize more complicated societal issues with various contexts mixed in, we need to combine lots of different data sets. We also need to think about the reliability and validity of the data. If the data is incorrect, then we may make wrong decisions due to false perception or misunderstanding. |
client : club eden, 2009 |