|
_ _ _ _ _ _ _ _ _ _ _ _ _ _ _ _ _ _ _ __ _ __ _ _ _ _ _ _ _ __ __ _ _ _ _ __ _ _ _ _ _ _ _ _ _ _ _ _ _ _ _ _ _ _ _ _ _ _ _ _ _ _ __ _ __ _ _ _ _ _ _ _ __ __ _ _ _ _ __ _ _ _ _ _ _ _ _ _ _ _ _ _ _ _ _ _ _ _ _ _ _ _ _ _ _ __ _ __ _ _ _ _ _ _ _ __ __ _ _ _ _ __ _ _ _ _ _ _ _ _ _ _ _ _ _ _ _ _ _ _ _ _ _ _ _ _ _ _ __ _ __ _ _ _ _ _ _ _ __ __ _ _ _ _ __ _ _ _ _ _ _ _ _ _ _ _ _ _ _ _ _ _ _ _ _ _ _ _ _ _ _ __ _ __ _ _ _ _ _ _ _ __ __ _ _ _ _ __ _ _ _ _ _ _ _ |
| Forming healthy nations! |
|
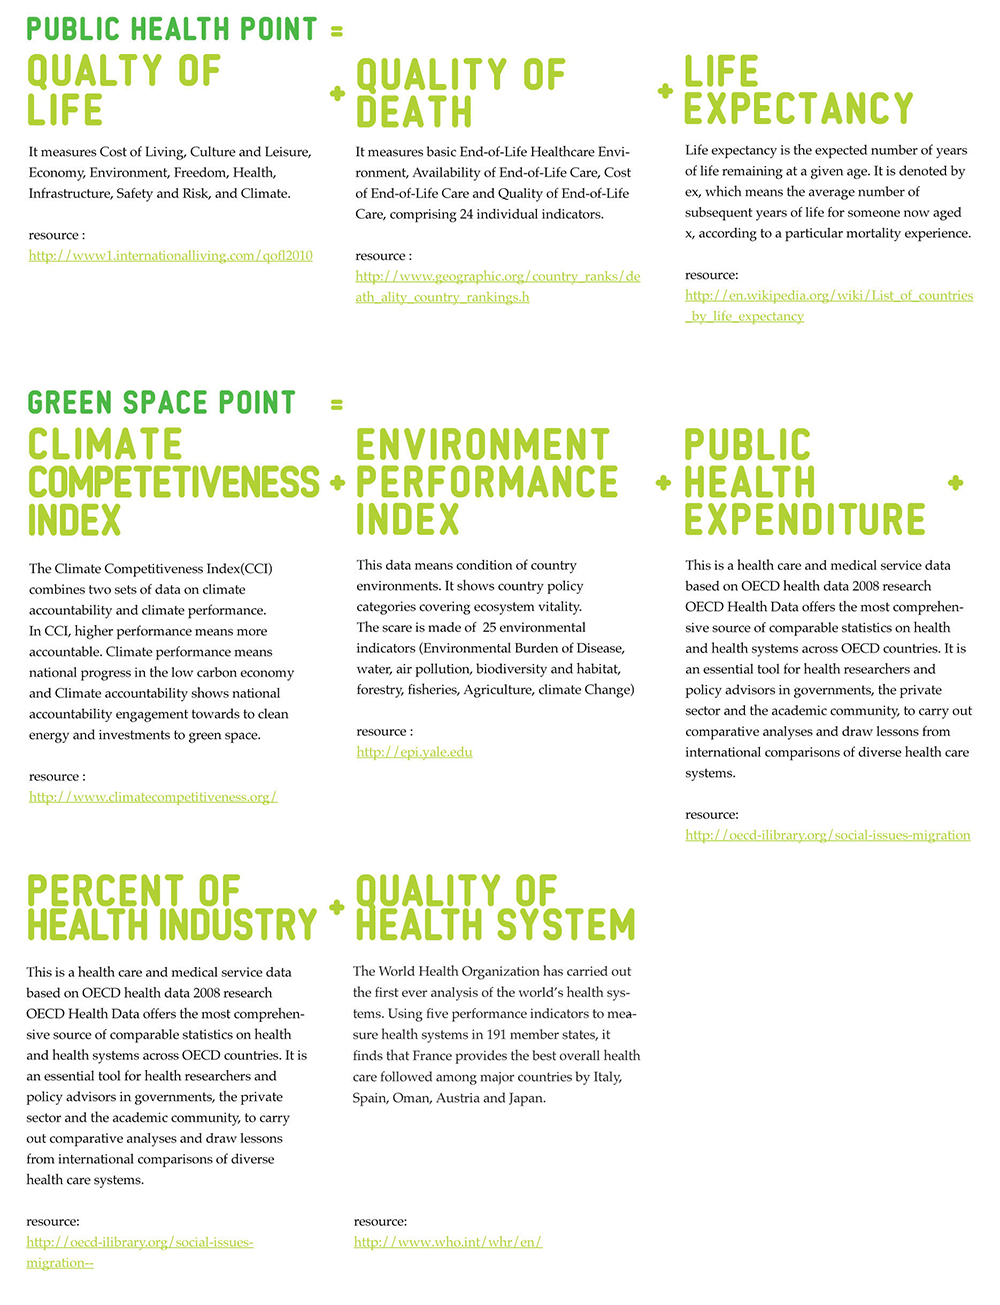
Health and Well-being index = balancing environmental factors and social structures For every 10% increase in green space, there can be a reduction in health complaints equivalent to a reduction of 5 years of age. (Dr William Bird, Natural Fit, 2004) We all know that green space and environmental conditions hugely influence our health. No one would doubt the health benefits of having green space. Having said that, before diving deeper into the correlation between green space and public health, we should have a better idea of what green space actually means. Green space could imply something more than just a physical eco-friendly environment. It could be a combination of the efforts of maintaining such a place and the quality of the health industry as well. From this perspective, green space could be defined not only by environmental factors but also with health and medical infrastructures, and political measures of preserving and increasing green space in the society. This project, “Forming healthy nations,” presents the relationship among national accountability engagement towards green space, national medical industry, and public health conditions and satisfaction. In this visualization, each country’s name is formed and filled up with full green colors by the total sum of government effort and volition on clean environment scores (CCI,EPI), national health care system conditions scores(Quality of health system, public expenditure on health, % of health industry on GDP), and each country’s public life and health quality(Quality of Life, Quality of Death, Life Expectancy). 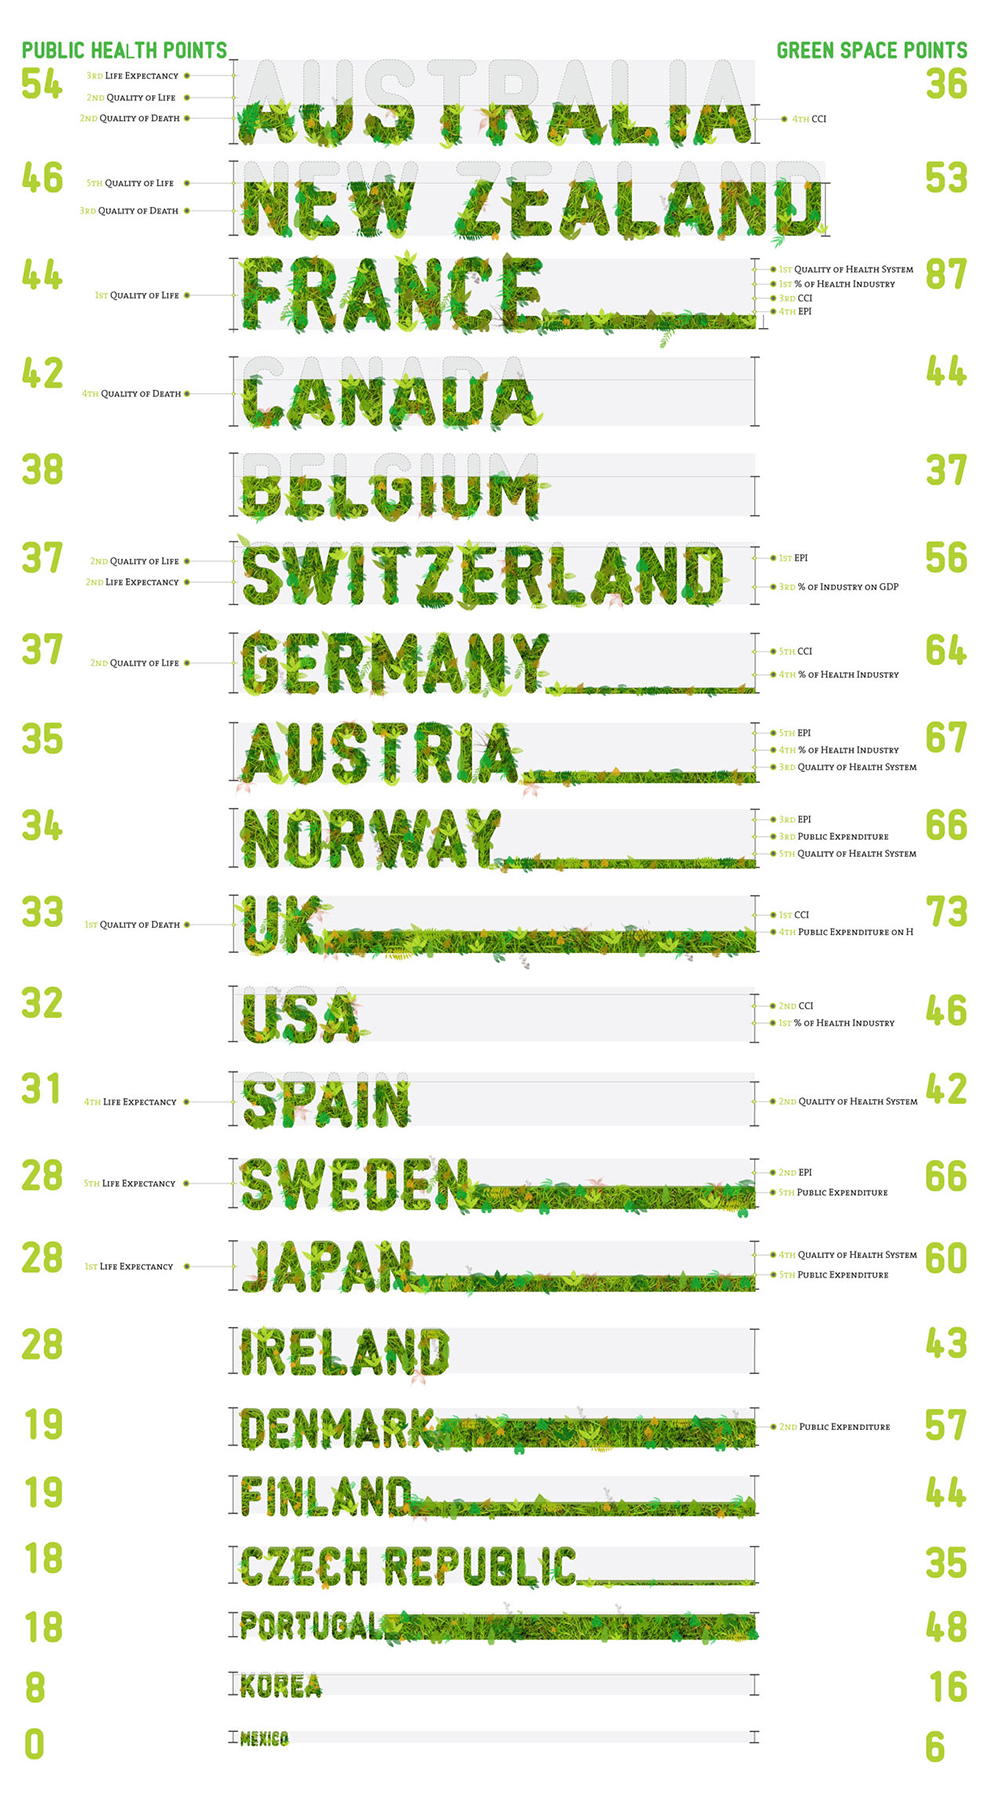 The size of each country’s name is associated with its public health data (Life Expectancy, Quality of life, Quality of death). The name is outlined only at the beginning, and the inside will be filled up with green elements gradually upon the values of the country’s green space data such as environmental policies, budgets, and quality of the healthcare system. Balancing the healthcare system, environmental factors and public health quality leads to “good life.” We should contribute alongside the governments and social structures for better public health. - - - - - - - - - - - - - - - - - - - - - - - - - - - - - - - - - - - - - - - - - - - - - - - - Explaination of data re-calculation: Public Health VS Green Space (national accountability + national health system) Green Space= Climate Competitiveness Index (CCI) + Environmental Performance Index (EPI) + public expenditure on health (per capita) + % of health industry on GDP + quality of health system Public health = Quality of Life Index (QLI) + Quality of Death Index (QDI) + life expectancy - - - - - - - - - - - - - - - - - - - - - - - - - - - - - - - - - - - - - - - - - - - - - - - - Green Space Data: Climate Competitiveness Index (CCI) The Climate Competitiveness Index(CCI) combines two sets of data on climate accountability and climate performance. In CCI, higher performance means more accountable. Climate performance means national progress in the low carbon economy and Climate accountability shows national accountability engagement towards to clean energy and investments to green space. resource : http://www.climatecompetitiveness.org/ Green space data : Environmental Performance Index (EPI) This data means condition of country environments. It shows country policy categories covering ecosystem vitality. The scare is made of 25 environmental indicators (Environmental Burden of Disease, water, air pollution, biodiversity and habitat, forestry, fisheries, Agriculture, climate Change) resource : http://epi.yale.edu/ Green Space Data : Public Expenditure on Health per Capita This is a health care and medical service data based on OECD health data 2008 research OECD Health Data offers the most comprehensive source of comparable statistics on health and health systems across OECD countries. It is an essential tool for health researchers and policy advisors in governments, the private sector and the academic community, to carry out comparative analyses and draw lessons from international comparisons of diverse health care systems. resource: http://www.oecd-ilibrary.org/social-issues-migration-health/public-expenditure-on-health-2010_20758480-2010-table3 Green Space Data : % of health industry on GDP This is a health care and medical service data based on OECD health data 2008 research. OECD Health Data offers the most comprehensive source of comparable statistics on health and health systems across OECD countries. It is an essential tool for health researchers and policy advisors in governments, the private sector and the academic community, to carry out comparative analyses and draw lessons from international comparisons of diverse health care systems. resource: http://www.oecd-ilibrary.org/social-issues-migration-health/public-expenditure-on-health-2010_20758480-2010-table3 Green Space data : quality of health system The World Health Organization has carried out the first ever analysis of the world’s health systems. Using five performance indicators to measure health systems in 191 member states, it finds that France provides the best overall health care followed among major countries by Italy, Spain, Oman, Austria and Japan. resource : http://www.who.int/whr/en/ http://www.photius.com/rankings/who_world_health_ranks.html 
|