|
_ _ _ _ _ _ _ _ _ _ _ _ _ _ _ _ _ _ _ __ _ __ _ _ _ _ _ _ _ __ __ _ _ _ _ __ _ _ _ _ _ _ _ _ _ _ _ _ _ _ _ _ _ _ _ _ _ _ _ _ _ _ __ _ __ _ _ _ _ _ _ _ __ __ _ _ _ _ __ _ _ _ _ _ _ _ _ _ _ _ _ _ _ _ _ _ _ _ _ _ _ _ _ _ _ __ _ __ _ _ _ _ _ _ _ __ __ _ _ _ _ __ _ _ _ _ _ _ _ _ _ _ _ _ _ _ _ _ _ _ _ _ _ _ _ _ _ _ __ _ __ _ _ _ _ _ _ _ __ __ _ _ _ _ __ _ _ _ _ _ _ _ _ _ _ _ _ _ _ _ _ _ _ _ _ _ _ _ _ _ _ __ _ __ _ _ _ _ _ _ _ __ __ _ _ _ _ __ _ _ _ _ _ _ _ |
| Data Currency, powered by network actions |
|
“How can we place value on our daily network activity?” We go on Facebook, Twitter, email, google search and upload/download digital files in a network environment every single day. We produce and consume data. Depending on our network activity, some data would be given more value than others while some would be underestimated or disappear without notice. Some information would stand out, while some would rarely be used. 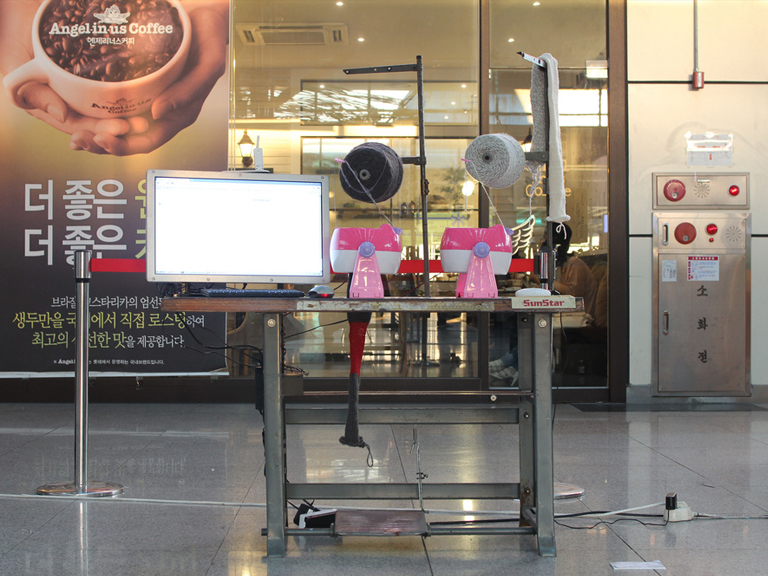
Data Currency is a visualization system that reveals our network actions in terms of network labor. In other words, going on Facebook, tweeting, and searching on Google could be considered “labor” in a network environment. This hybrid table, “Data Currency,” converts search activities into physical energy. 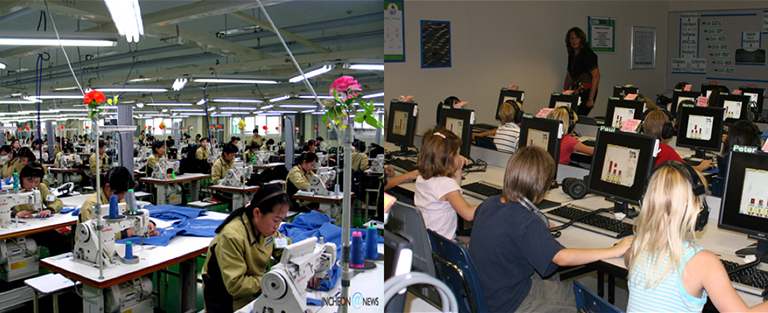
This idea came about from comparing the similarities between sewing factories and computer labs. Factory workers work for a production line, and computer users use their physical energy towards data. 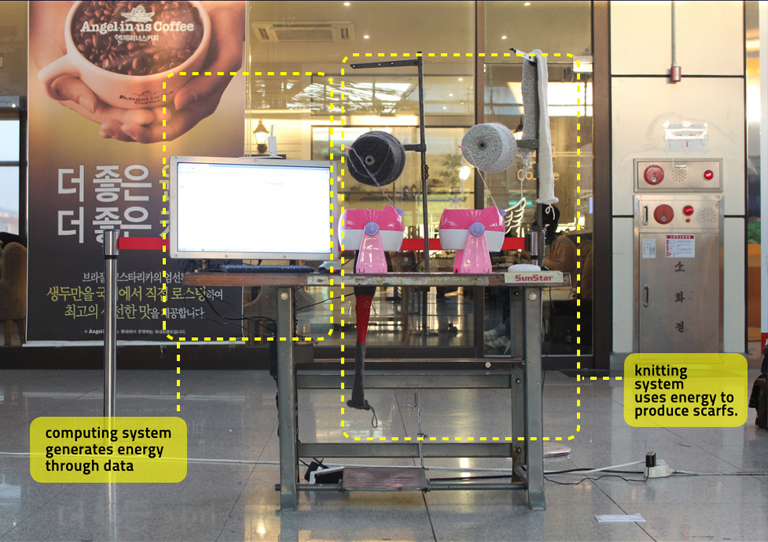
This physical installation combines a computer with a knitting system. Users search and produce data on the installed computer on the left, which generates the power to run the knitting machines on the right. The amount of power it generates is based on the value of the information produced. [video] exhibition : Gwang Ju Biennale (2011), Art Center Nabi (2012), Juan Media Art (2012), Sungnam Art Center (2013) |