|
_ _ _ _ _ _ _ _ _ _ _ _ _ _ _ _ _ _ _ __ _ __ _ _ _ _ _ _ _ __ __ _ _ _ _ __ _ _ _ _ _ _ _ _ _ _ _ _ _ _ _ _ _ _ _ _ _ _ _ _ _ _ __ _ __ _ _ _ _ _ _ _ __ __ _ _ _ _ __ _ _ _ _ _ _ _ _ _ _ _ _ _ _ _ _ _ _ _ _ _ _ _ _ _ _ __ _ __ _ _ _ _ _ _ _ __ __ _ _ _ _ __ _ _ _ _ _ _ _ _ _ _ _ _ _ _ _ _ _ _ _ _ _ _ _ _ _ _ __ _ __ _ _ _ _ _ _ _ __ __ _ _ _ _ __ _ _ _ _ _ _ _ _ _ _ _ _ _ _ _ _ _ _ _ _ _ _ _ _ _ _ __ _ __ _ _ _ _ _ _ _ __ __ _ _ _ _ __ _ _ _ _ _ _ _ |
| Circulating Data |
|
Circulating data is the process of transferring data from data producers to the public. |
|
|
|||
|
[background] This project is a concept design for the new headquarter building for SK Chemicals in Pangyo, Korea. They wanted digital art work for a four story wall in the building’s main atrium. The space is open to the public. |
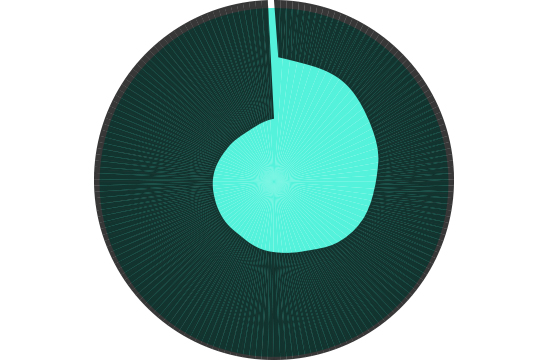
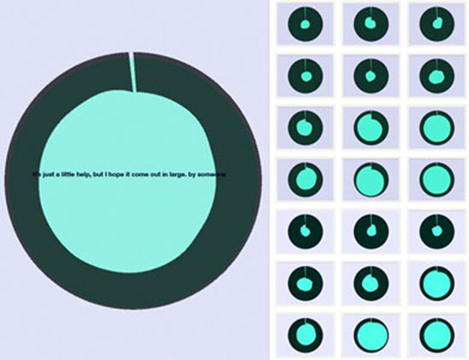
stage_01 : seeing and understanding This building operates a water purification system, which purifies rainwater into drinkable water. I created a visual representation depicting how much water the building conserved so that the public could understand the building's eco energy system. The inner circle grows bigger and bigger with the amount of water conserved. |
stage_02 : understanding and transfering When the graphic is filled up, people are able to donate the conserved water to places that need it through their cell phones. In this example, the data circulates to the public, who then interprets it and decides the recipients that are in need of clean water. This process is possible through a good understanding of the underlying data, mediated through visualization. |
This project focused on the building’s green systems as well as visual aesthetic values.The visualization can spark social contribution to the approach of their water conservation system. |